May 2018 Q1 c.
SHOCKS IN THE GHANAIAN BANKING INDUSTRY
Introduction
The news on August 14, 2017 to the effect that the licenses of two indigenous banks – UT Bank and Capital Bank have been revoked came as a surprise to the Ghanaian business community, since the two banks had won numerous awards for performing well in the industry. The two banks were taken over by GCB Bank Ltd. In the 2011 Ghana Banking Awards, UT Bank was adjudged the Bank of the year. Capital Bank was also adjudged the Best Growing Bank, and Best Bank in Deposits & Savings in 2016. A press statement issued by Bank of Ghana (BoG) read in part as follows: “The Bank of Ghana has revoked the Licences of UT Bank Ltd and Capital Bank Ltd. This action has become necessary due to severe impairment of their capital. The two banks have high non-performing loans. UT Bank and Capital Bank were deeply insolvent, meaning that their liabilities exceeded their assets, putting them in a position not to be able to meet their obligations as and when they fell due”. This revocation was in line with Section 123 of the Banks and Specialised Deposit Taking Institutions (SDIs) Act 2016 (Act 930). The Act states that “when a bank is in distress, the Bank of Ghana revokes its license, possesses the bank, appoints a receiver and then put it up for sale”. In this case, GCB Bank Ltd acquired the banks, while Bank of Ghana appointed PricewaterhouseCoopers (PWC) as the receiver.
To avoid a run on other banks and to minimise instability in the financial sector, all deposits and selected assets of the two Banks were transferred to GCB Bank Ltd, thereby assuring the depositors of their funds. The combined deposits of the two banks were estimated to be over GH¢2 billion, which far exceeds available liquid assets
As at the close of February 28, 2018, GCB Bank Ltd had successfully completed the full integration of the systems of the erstwhile UT Bank and Capital Bank by retaining 22 out of the 53 branches based on their location and accessibility to customers as well as absorption of more than half of permanent staff of those Banks. The acquisition of the two failed Banks by GCB Bank has increased its branch network across the country to 183.
The Ghanaian Banking Industry
The number of banks operating in Ghana had increased from 25 in 2010 to 34 as at the close of 2017. To outwit increasing competition in the industry, a wide array of products and services are being offered by the banks in order to attract customers. The accounts opening process has been simplified across the industry and makes it easier to open account with any bank. The non-banking financial institutions are offering higher returns/yields on deposits compared to that of the banks making deposit mobilization in the industry more difficult and expensive. However, the rates offered by the commercial banks on loans are, generally much lower than that available in the non-banking financial services segment. The major risk facing the industry is the quality of assets (loans), as reflected in high Non-Performing Loans (NPL) ratio, which edged up from 17.3% to 22.7% in December 2016 and 2017 respectively. In response to worsening NPL ratio, banks are tightening credit risk stance by cutting back on loans and advances portfolio and redirecting the funds to the money market and government securities even though the rates on those securities have been trending downward from 2017.
Another significant change in the industry is the switch from IAS 39 to IFRS 9 Financial Instrument – recognition and measurement effective January 1, 2018. The new standard changes measurement of impairment from historical credit loss to expected credit loss model, which recognises life-time expected credit loss based on forward looking information. This is anticipated to result in higher provision for loan losses and further impairment of the capital of banks.
Extract of selected Financial Soundness Indicators of the Ghanaian Banking Industry for the year end 2014 was as follows:
%
Net interest income growth 12.7
Cost to income ratio 56
Asset utilization ratio 8.8
Return on Equity 30.8
Profit after tax growth 66.5
The rise and fall of UT Bank and Capital Bank
The two defunct banks started as non-banking financial institutions and, subsequently, acquired banking license. They entered the banking landscape with legacies of expensive funds and huge NPL, making them less competitive. Since the collapse of the two banks, the media space has been agog with discussions by financial experts on the reasons for the failure of the two banks. Questions have been asked of the regulatory and supervisory role of the Bank of Ghana, since the failure was not an event, but a failure of processes over time. The integrity of the clean audit opinions issued by the external auditors on the two banks over the years have been questioned. At the time of the collapse in 2017, the two defunct banks had for the previous year not published their financial statements.
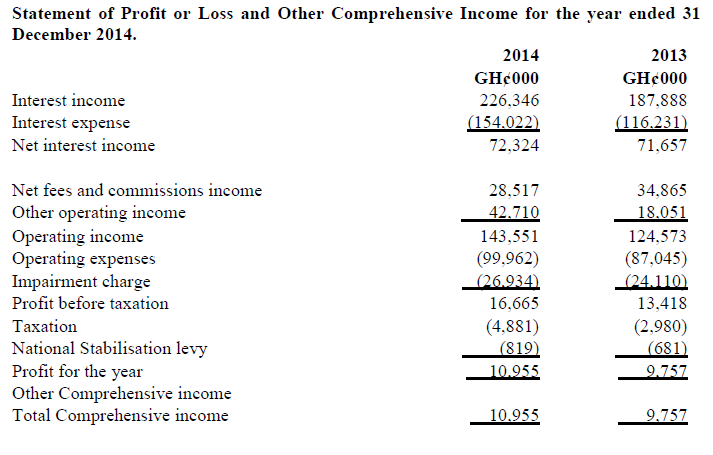
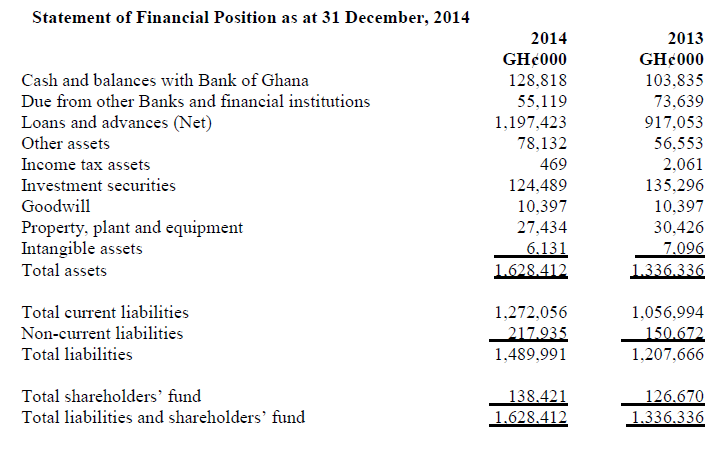
Below is extracts of the financial statements of one of the defunct banks.


Regulator’s action
Some recent measures by the Bank of Ghana to address vulnerabilities in the financial sector include: increase of minimum capital from GH¢120 million to GH¢400 million effective December 31, 2018 and a temporary freeze on issuance of new licenses in 2018. In July 2016, the Banks and Specialised Deposit-Taking Institutions Act, 2016 (Act 930) was passed by Parliament to tighten regulation of the banks. The Act limits the powers of Bank of Ghana in granting waivers to the banks, especially single obligor, which limits the risk of exposure to a single customer. Again, the Act imposes heavier sanctions for regulatory breaches.
To improve the quality of risk management, corporate governance and internal control practices in the banks, Bank of Ghana has issued directive to the banks to implement Basel II/III Capital Framework effective June 30, 2018. This imposes stringent requirements for capital measurement.
Addressing the annual dinner of the Chartered Institute of Bankers (Ghana) on December 2, 2017, the Governor of the Bank of Ghana made some remarks about the failure of the two defunct banks. Exhibit 1 below contains portions of the said speech.
Exhibit 1
“Despite the improved regulatory environment and supervisory frameworks, we have witnessed the dissolution of two banks this year. While no systemic challenges to the financial sector arose from the dissolution, it is useful to understand the underlying factors and reposition the sector to avoid the same mistakes in the years ahead.
Let me be upfront and say that though the failure of the two banks was due to significant capital deficiencies, the underlying reason was poor corporate governance practices within these institutions. In this instance, we saw the dominant role of shareholders who exerted undue influence on management of the banks, leading to poor lending practices. This was also reinforced by weak risk management systems and poor oversight responsibility by the boards of directors. Some of the examples of recklessness that led to the failure of the two banks include:
Co-mingling of the banks’ activities with their related holding companies. For instance, one bank was paying royalties for the brand name, even at a time that the bank’s financial performance was abysmal and could not pay dividends. Interestingly, the royalties were approved by four (4) out of seven (7) members of the Board without the consent of the other significant minority shareholders including an International Financial Institution. As a result, the international institution placed a notice on its website abrogating all relationships with the Bank and this led to most of the foreign lenders cutting off their credit lines to the Bank and recalling their credits thereby creating serious liquidity squeeze to the bank.
Also, very high executive compensation schemes were being operated by the affected banks which were not commensurate with their operations. The risk and earnings profile of the banks could not support the compensation schemes.
Non-Executive Directors of the banks compromised their independence and fiduciary duties to serve as checks on Executive Directors. This was because rewards such as business class air tickets were being granted to them annually.
Interference by Non-Executive Directors in the day-to-day administration of the banks weakened the management oversight function of executive directors. Some non-Executive Directors were also acting as consultants to the same banks with no clear mandate, which gave rise to conflict of interest situations.
Non-adherence to credit management principles and procedures as the banks were heavily exposed to insiders and related parties. There was also no evidence of interest payments on these investments. The investments were therefore impaired, but some members of the Board at the time accepted the responsibility to pay off the said amount through a board resolution.
Diversion of funds to holding companies and their related parties was widespread. In the case of one Bank, placements could not be traced to the bank’s records though some customers showed proof of their investments with the Bank. Irregular board meeting also accounted for the weaknesses in the board oversight.
In all of these cases, one thing was clear, and that is, the banks could not delineate themselves from their past practices as finance houses. They followed the same practice of borrowing from high net worth persons at a very high costs without any plans to bring themselves in line with the industry norm”
Required:
Using the selected Financial Soundness Indicators of the banking industry as benchmark, assess the operational efficiency and profitability of the selected defunct bank for the year end 2014 based on the financial statements above. (15 marks)
View Solution

Operating Efficiency
Operating efficiency ratios are typically used to analyse how well a company uses its assets and liabilities internally. An efficiency ratio can calculate the turnover of receivables, the repayment of liabilities, the quantity and usage of equity, and the general use of inventory and machinery. This ratio can also be used to track and analyse the performance of commercial and investment banks.
An efficiency ratio measures a company’s ability to use its assets to generate income. Ratios in the Financial Soundness Indicators that can be used to assess the Operational efficiency are cost to income ratio and asset utilisation ratio.
- Cost to income ratio
The cost-to-income ratio is a key financial measure, particularly important in valuing banks. It shows a company’s costs in relation to its income. The ratio gives investors a clear view of how efficiently the firm is being run – the lower it is, the more profitable the bank will be.
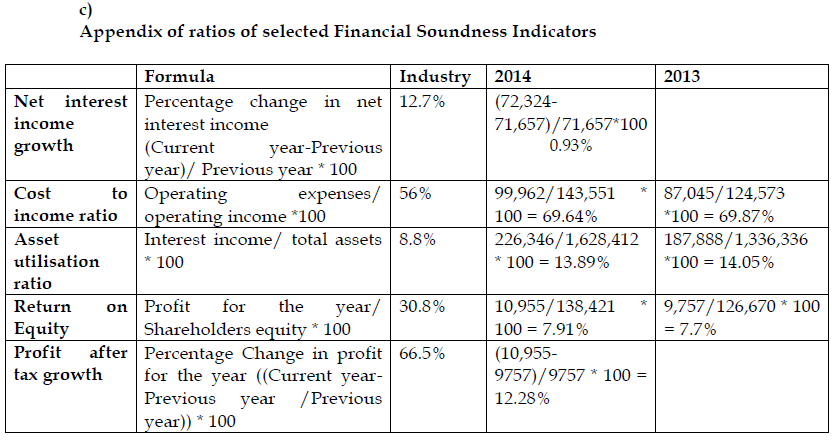
There was an insignificant improvement in the cost to income ratio from 69.87% in 2013 to 69.64% in 2014 but still compares unfavourably to the industry average 56%. This suggests that the defunct banks were operating less profitably than the banking industry as costs are rising at a higher rate than income which could suggest that the banks were less efficient in driving down their operating cost to match the falling operating income.
This could have been improved by reducing labour costs, implementing more efficient operations by adopting technology-driven solutions, and increase sales and income. - Asset utilisation ratio
The asset utilization ratio calculates the total revenue earned for every cedi of investment in assets. This ratio is frequently used to compare a company’s efficiency over time. Asset utilisation ratio is an analytical tool that identifies whether company is effectively putting assets to work in terms of income generation of or not.
In 2013, the asset utilisation was 14.05% and it reduced to 13.89%. This means that the defunct banks earned GH¢0.14 for every cedi invested in assets and it earned GH¢0.1389 for every cedi invested in 2014. This suggests that the defunct banks were more efficient in using assets compared to the industry average ratio of 8.8% of GH¢0.088 per cedi invested. Banks in the industry are earning as low as GH¢0.08 for every cedi invested.
Profitability
Profitability ratios are financial metrics used by businesses to measure and evaluate their ability to generate income (profit) relative to revenue, balance sheet assets, operating costs, and shareholders’ equity during a specific period of time. They show how well a company utilizes its assets to produce profit and value to shareholders.
A higher ratio or value is sought-after by most companies, as this would mean the business is performing well by generating revenues, profits, and cash flow. Ratios in the Financial Soundness Indicators that can be used to assess the Profitability of the defunct bank are Return on Equity, profit after tax growth and net income growth.
Return on Equity (ROE)
Return on equity (ROE) is the amount of net income returned as a percentage of shareholders equity. A rising ROE suggests that a company is increasing its ability to generate profit without needing as much capital. It also indicates how well a company’s management is deploying the shareholders’ capital.
There was an insignificant increment in ROE from 7.7% in 2013 to 7.9% in 2014. This signifies how bad the banks were in generating returns on the investment it received from its shareholders as compared to the industry average of 30.8%. The defunct banks could not have attracted investors compared to the other banks in the industry hence the ultimate failure.
Profit after tax growth
The net amount earned by a business after all taxation related expenses have been deducted. The profit after tax is often a better assessment of what a business is really earning and hence can use in its operations than its total revenues.
A company’s profit after tax is significant because it shows how well a company controls its costs. A high profit after tax growth generally indicates that a company runs efficiently, providing more value, in the form of profits, to shareholders. The defunct banks performed poorly (12.28%) in terms of their ability to grow profit in subsequent year compared to the industry average of 66.5%. This suggests the defunct banks were not run efficiently in terms of controlling its costs, providing more value for shareholders and making profits.
Net interest income growth
Net interest income is the difference between the revenue that is generated from a bank’s assets and the expenses associated with paying out its liabilities. A typical bank’s assets consist of all forms of personal and commercial loans, mortgages and securities. The liabilities are the customer deposits. The excess revenue that is generated from the interest earned on assets over the interest paid out on deposits is the net interest income.
Net Interest Margin measures the effectiveness of a bank’s investment decisions, particularly for financial institutions. The net income growth for the defunct banks is 0.93% which compares unfavourably to the industry average of 12.7%. This indicates that the defunct banks have been achieving increasingly lower returns/margins on their assets resulting from non-performing loans, while failing to attract cheaper deposits in form of demand and savings account. The reduced net interest margins ultimately impacted negatively on the defunct banks resulting in their failure.
