Kack Ltd is a listed company that assembles domestic electrical goods which it then sells to both wholesale and retail customers. Kack Ltd’s management was disappointed in the company’s results for the year ended 31 March 2014. In an attempt to improve performance the following measures were taken early in the year ended 31 March 2015:
A national advertising campaign was undertaken,
Rebates to all wholesale customers purchasing goods above set quantity levels were introduced,
The assembly of certain lines ceased and was replaced by bought in completed products. This allowed Kack Ltd to dispose of surplus plant.
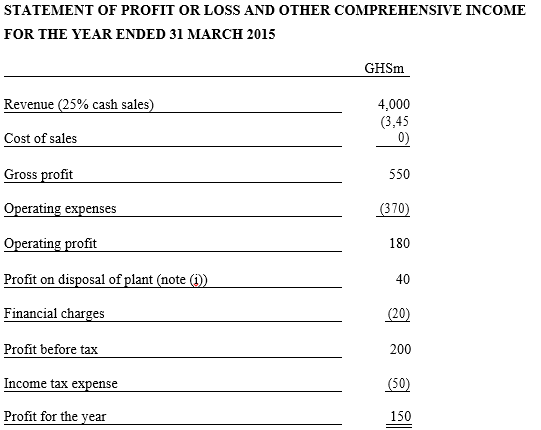
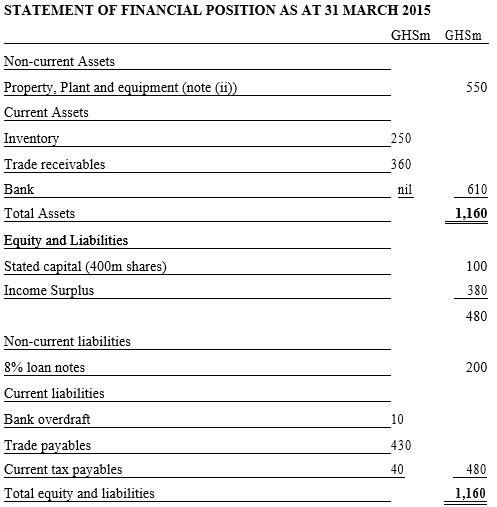
Kack Ltd’s summarised financial statements for the year ended 31 March 2015 are set out below:


Below are ratios calculated for the year ended 31 March 2014:
Return on year end capital employed (profit before interest and tax over total assets less current liabilities) 28.1%
Net assets (equal to capital employed) turnover 4 times
Gross profit margin 17%
Net profit (before tax) margin 6.3%
Current ratio 1.6:1
Closing inventory holding period 46 days
Trade receivables’ collection period 45 days
Trade payables’ payment period 55 days
Dividend yield 3.75%
Dividend cover 2 times
Notes:
*Kack Ltd received GHS 120m from the sale of plant that had a carrying amount of GHS 80m at the date of its sale.
*The market price of Kack Ltd’s share throughout the year averaged GHS3.75 each.
*There were no issues or redemption of shares or loans during the year.
*Dividends paid during the year ended 31 March 2016 amounted to GHS 90m, maintaining the same dividend paid in the year ended 31 March 2015.
Required:
(a) Calculate ratios for the year ended 31 March, 2015 (showing your workings) for Kack Ltd, equivalent to those provided above. (10 marks)
View Solution
Return on Capital Employed (ROCE)
Profit before Interest and Tax / Total Assets – Total Current Liabilities
220/680×100 = 32.3%
Net assets turnover
Turnover / Net Assets
4,000/680 =5.9 times
Gross Profit Margin
Gross Profit /Turnover
550/4,000 ×100 = 13.8%
Net Profit Margin
Profit before Tax / Turnover
200/4,000 ×100 =5%
Current ratio
Current Assets / Current Liabilities
610/480 = 1.27: 1
Closing Inventory holding period
Average Inventory / Cost of Sales
250/3,450 ×365 = 26 days
Trade receivables collection period
Trade Receivable / Credit Sales x 365
360/3,000 ×365 = 44 days
Trade payables payment period
Trade Payables / Credit Purchase x 365
430/3,450 × 365 = 45 days
Dividend yield
Dividend per Share / Market Price per Share x 100
22.5/375*×100 = 6%
*Dividend per share
Dividend Paid / No. of Share
(90/400)/
Dividend cover
Net Profit after Tax / Dividend Paid
150/90 = 1.67 times
(b) Analyse the financial performance and position of Kack Ltd for the year ended 31 March 2015 compared to the previous year. (10 marks)
View Solution
The first thing to notice about Kack’s results is that the ROCE has increased by 4.2 percentage points, from 28.1 to 32.3. On the face of it, this is impressive. However, we have to take into account the fact that the capital employed has been reduced by the plant disposal and the net profit has been increased by the profit on disposal. So the ROCE has been inflated by this transaction and we should look at what the ROCE would have been without the disposal. Taking out the disposal gives us the following ratios:
ROCE =180/ (680+80) × 100 = 23.7%
Net asset turnover = 4,000/760 = 5.3 times
Net profit margin =160/4,000 × 100 = 4%
Comparing these ratios to those for the period ended 31 March 2014 we can see that ROCE has fallen. This fall has been occasioned by the fall in the net profit margin. The asset turnover has improved on the previous year after adding back the disposal.
The net profit margin can be analysed into two factors – the gross profit margin and the level of expenses. The gross profit percentage is 3.2 % down on the previous year. This is probably due to the rebates offered to wholesale customers, which will have increased sales at the expense of profitability. The replacement of some production lines by bought in products will probably also have reduced profit margins. Sales may have been increased by the advertising campaign, but this has been additional expense charged against the net profit. It looks as if management have sought to boost revenue by any available means. The plant disposal has served to mask the effect on profits.
Kack’s liquidity has also declined over the current year. The current ratio has gone down from 1.6 to 1.3. However, there has also been a sharp decline in the inventory holding period, probably due to holding less raw material for production. It could be that the finished good can be delivered direct to the wholesalers from the supplier. This will have served to reduce the current ratio. The receivables collection period has remained fairly constant but the payables payment period has gone down by 10 days. It looks as if, in return for prompt delivery, the finished goods supplier demands prompt payment. This fall in the payables period will have served to improve the current ratio. We do not have details of cash balances last year, but Kack currently has no cash in the bank and a GHS 10 m overdraft. Without the GHS 120m from the sale of plant the liquidity situation would obviously have been much worse.
The dividend yield has increased from 3.75% to 6 %, which looks good as far as potential investors are concerned. But we are told that the dividend amount is the same as last year. As there have been no share issues, this means that the dividend per share is the same as last year. Therefore the increase in dividend yield can only have come about through a fall in the share price. The market is not that impressed by Kack’s results. At the same time the dividend cover has declined. Do the same dividend has been paid on less profit (last year’s dividend cover was 2.0, so profit must have been GHS 180m). Management decided it was important to maintain the dividend, but this was not sufficient to hold the share price up.
To conclude, we can say that Kack’s position and performance is down on the previous year and any apparent improvement is due to the disposal of plant.
