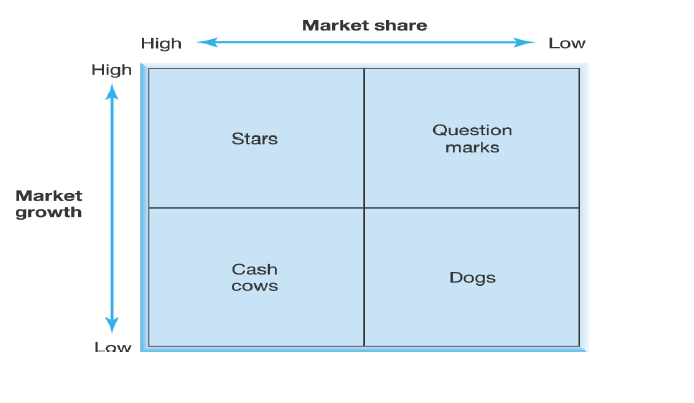
The Boston Consulting Group (BCG) Growth Share Matrix is a model which plots Strategic Business Units’ (SBUs) market growth and relative market share.
Many public sector organisations are now experiencing increasing levels of competition for the supply of their services. This competitive environment has resulted in the need for such public sector organisations to develop analytical techniques which previously operated mainly within the private sector.
Required:
a) Explain how the BCG Growth Share Matrix could be used to analyse, business portfolio and strategic options. (12 marks)
View Solution
Most products, markets and even industries pass through clear stages of a life cycle. The position of a product can range from its introduction to the market, through a period of growth in sales and profits until its saturation, decline and eventual obsolescence. Ideally, a company needs a balanced range of products passing through different stages of the life cycle. The BCG Growth Share matrix is one of the methods used to analyse the balance of the product portfolio and illustrate the expected changes in the cash flow as products move through the various stages. The model is deliberately simplistic in that it focuses on cash flow and uses two variables, market growth and market share. As a generalisation, the cash characteristics of the products are defined by
the quadrants into which they fall:

The matrix identifies four types of product or service: dogs, cash cows, problem children (question marks) and stars, and suggests appropriate strategies for each.
- Cash cows are high share SBUs operating in a low growth industry and should be generating substantial cash inflows. The period of high growth in the market has ended, (the product life cycle is in the maturity or decline stage), and consequently
the market is less attractive to new entrants and existing competitors. Cash cow products tend to generate more cash than is needed to sustain their market positions. These businesses should be a source of substantial amounts of cash that can be channeled to other areas. - A star product has a high relative market share in a high growth industry. This type of product may be in a later stage of its product life cycle. A star may be only cash neutral despite its strong position, as considerable expenditure will be required to defend its position against competitors. Failure to support a star may lead to the product losing its leading market share position, slipping eastwards in the matrix and becoming a problem child. A star, however, represents the best future prospects for an organisation. As the growth rate for a star slows, it will drop vertically in the matrix into the cash cow quadrant and its cash characteristics will change.
- A problem child or question mark is a low market share product in a high growth industry. Substantial net cash input is required to maintain or increase market share in the face of strong competition. The planner must decide whether to market more intensively or get out of this market. The questions are whether this product can compete successfully with adequate support, and what that support will cost.
- Dogs are low share SBUs in low growth markets. They are often cash users and can perpetually absorb cash, because of the investment required to maintain position. An organisation with such a product can attempt to appeal to a specialised market, delete the product or harvest profits by cutting back support services to a minimum.
Once the products are analysed using the model, a strategy for improving overall market share can be developed. Most organisations take cash from the cash cows to fund both development of future SBUs, and those problem children that have the potential to gain share to achieve star status.
