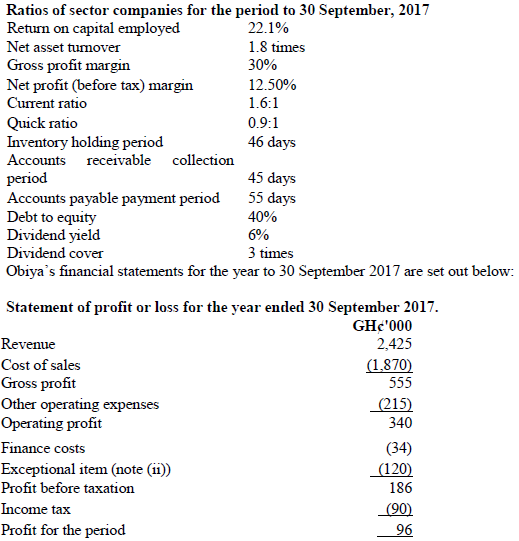
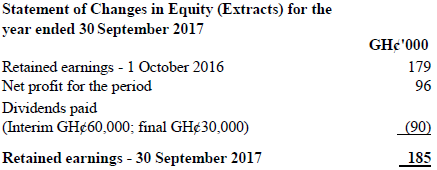
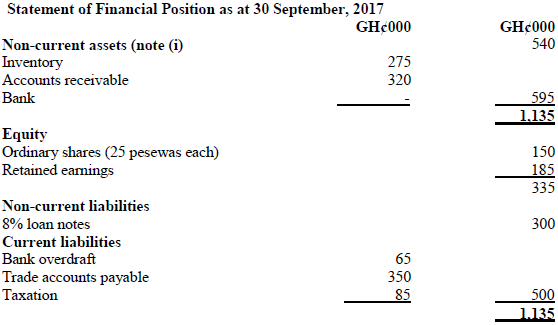
Obiya ltd assembles computer equipment from bought in components and distributes them to various wholesalers and retailers. It has recently subscribed to an inter-firm comparison service. Members submit accounting ratio as specified by the operator of the service, and in return, members receive the average figures for each of the specified ratios taken from all of the companies in the same sector that subscribe to the service. The specified ratios and the average figures for Obiya’s sector are shown below.


Notes:
i) The details of the non-current assets are:
Cost Accumulated depreciation Net book value
GH¢000 GH¢000 GH¢000
At 30 September 2017 3,600 3,060 540
ii) The exceptional item relates to losses on the sale of a batch of computers that had become worthless due to improvements in microchip design.
iii) The market price of Obiya’s shares throughout the year averaged GH¢6.00 each.
Required:
a) Calculate the ratios for Obiya equivalent to those provided by the inter-firm comparison service. (5 marks)
View Solution

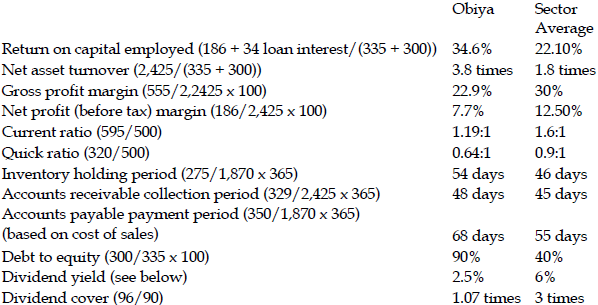
The workings are in GH₵’000 (unless otherwise stated) and are for Obiya’s ratios.
The dividend yield is calculated from a dividend per share figure of 15p (GH₵90,000/150,000 × 4) and a share price of GH₵6.00.
Thus the yield is 2.5% (15p/GH₵6.00 × 100%).
b) Write a report analysing the operational performance, gearing, investment and liquidity of Obiya based on a comparison with the sector averages. (10 marks)
View Solution
REPORT
To:
From:
Subject: Analysis of Obiya’s financial performance and financial position compared to sector average for the year to 30 September 2017.
Operation performance
- The return on capital employed of Obiya is impressive being more than 50% higher than the sector. The component of the return on capital employed are the asset turnover is much higher [nearly double] than the average, but the net profit margin after exceptionals are considerable below the sector average. However, if the exceptionals are treated as one off costs and excluded, Obiya’s margins are very similar to the sector average.
- This short analysis seems to imply that Obiya’s superior return on capital employed is due entirely to an efficient asset turnover i.e Obiya is making its assets work twice as efficiently as its competitors. A closer inspection of the underlying figures may explain why its asset turnover is so high. It can be seen from the note to the statement of financial position that Obiya’s non-current asset appear quite old .Their net book value is only 15% of their original cost. This has at least two implications; they will need replacing in the near future and the company is already struggling for funding; and their low net book value gives a high figure for asset turnover. Unless Obiya has underestimated the life of its asset in its depreciation calculation, its non-current asset will need replacing in the near future. When this occurs its asset turnover and return on capital employed figures will be much lower.
- This aspect of ratio analysis often causes problems and to counter this anomaly some companies calculate the asset turnover using the cost of non-current asset rather than their net book value as this gives a more reliable trend.it is also possible that Obiya is using asset that are not on its statement of financial position . It may be leasing asset that do not meet the definition of finance lease and thus the asset and corresponding obligation are not recognized on the statement of financial position.
- A further issue is which of the two calculation margin should be compared to the sector average (i.e. including or excluding the effect the exceptional losses). The gross profit margin of Obiyas is much lower than the sector average. If the exceptional losses were taken in at trading account level, which they should be as they relate to obsolete inventory, Obiya’s gross margin would be even worse. As Obiya’s net margin is similar to the sector average, it would appear that Obiya has better control over its operating cost .This is especially true as the other element of the net profit calculation is finance cost and as Obiya has much higher gearing than the sector average, one would except Obiya’s interest to be higher than the sector average.
Liquidity
- Here Obiya shows real cause for concern. Its current and quick ratio are much worse than the sector average, and indeed far below expected norms. Current liquidity problems appear due to high levels of accounts payable and a high bank overdraft .The high levels inventory contribute to the poor quick ratio and may be indicative of further obsolete inventory [the exceptional items is due to obsolete inventory]. The accounts receivable collection figure is reasonable, but at 68 days, Obiya takes longer to pay its accounts payable than do its competitors. Whilst this is a source of ‘free’ finance, its can damage relations with supplier and may lead to a curtailment of further credit.
Gearing
As referred to above, gearing [as measured by debt/equity] is more than twice the level of the sector average. Whilst this may be an uncomfortable level, it is currently beneficial for shareholders. The company is making an overall return of 34.6%, but only paying 8% interest on its .loan notes. The gearing level may become a serious issues if Obiya becomes unable to maintain the finance costs. The company already has an overdraft and the ability to make further interest payment could be in doubt.
Investment ratio
Despite reasonable profitability figures, Obiya’s dividend yield is poor compared to the sector average. From the extracts of the changes in equity it can be seen that total dividends are 90,000 out of available profit for the year of only 96,000 [hence the very low cover]. It is worthy of note that the interim dividend was 60,000 and the final dividend only 30,000. Perhaps this indicates a worsening performance during the year, as normally final dividends are higher than interim dividends. Considering these factors, it is surprising the company’s share price is holding up so well.
