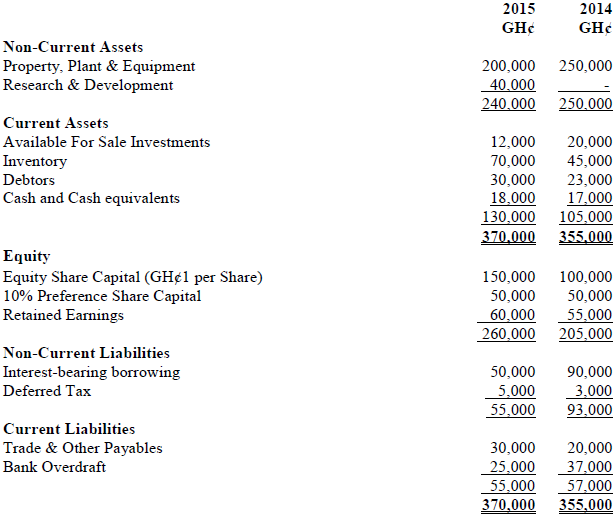
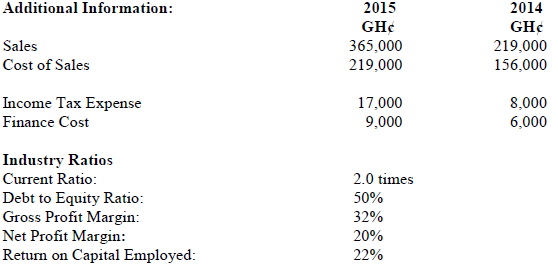
a) You are a private consultant for Ashtown Ltd, a listed company in Ghana operating in the manufacturing sector. Below is a Statement of financial position and a summarized statement of changes in equity with comparatives for the year ended 31 December 2015.
Statement of Financial Position as at 31 December 2015:


Required:
Prepare a report and address to the Chief Executive Officer, analyzing the financial performance and financial position of Ashtown Ltd based on the industry ratios above for the years 2014 and 2015. (12 marks)
View Solution
APPENDIX
i) Current Ratio = Currents Assets/Current Liability
ii) Debt to Equity = Debt/Equity*100
iii) Gross Profit Margin = Gross Profit/Sales * 100
iv) Net Profit Margin = Net Profit/Sales * 100
v) Return on Capital Employed = Profit before Interest & Tax/Capital Employed*100

REPORT
To : Chief Executive Officer
From : Consultant
Date : 31/12/2015
Subject : Financial Performance and Financial Position of Ashtown Ltd for the year ending 2015.
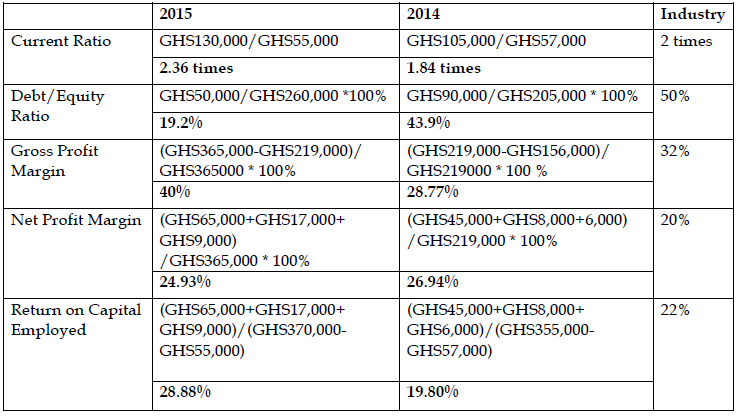
As requested, I have analyzed the financial performance and financial position of Ashtown Ltd. My analysis is based on the Statement of financial Position, summarised statement of changes in equity and the additional information given. A number of key measures have been calculated and these are set out in the attached Appendix.
Financial Performance
Financial performance is a quantitative measure of how well a firm can use assets from its primary mode of business and generate revenues using the financial statements. This can be measured using Gross Profit Margin, Net Profit Margin and Return on Capital Employed according to the Industry measures.
Gross profit margin measures Ashtown Ltd’s manufacturing and distribution efficiency during the production process. Gross profit margin has increased considerably (from 28.77% to 40%) during the year and this is great increment compared to the industry average of 32%. This High gross profit margin increment indicates that the company can make a reasonable profit, as long as it keeps the overhead cost in control. The company can improve this by cutting down cost of manufacturing and increasing sales.
Net profit margin measures company’s profitability or how much of each Ghana Cedi earned by the company is translated into net profits. Net profit margin is an indicator of how efficient a company is and how well it controls its costs. The higher the margin is, the more effective the company is in converting revenue into actual profit. The company did well in the previous year (26.94% compared to the industry average of 20%) doing better than the industry average. Although Ashtown Ltd’s Gross Profit margin increased considerably, there was a marginal fall in net profit margin in the current year (24.93%). The company should adopt cost reduction techniques to cut down the operational, administrative and selling expenses so as to increase profitability.
The Return on Capital Employed ratio helps assess how efficiently a company employs its available capital and is particularly helpful when comparing profitability across companies in the same business with similar amounts of working capital. From the ratios for every GHS1 employed, Ashtown gained GHS0.28 in 2015. Ashtown Ltd’s ROCE ratio is relatively high, (an improvement from 19.8% to 28.88%) that is commonly interpreted as an indication that the company is making more efficient use of its capital. The Company can improve the ROCE ratio in subsequent years by selling off of unprofitable or unnecessary assets this can be evidenced from disposing part of the available for sale instrument in the financial statements.
Financial Position
The status of the assets, liabilities, and owners’ equity (and their interrelationships) of an organization, as reflected in its financial statements is the financial position. The financial position helps users to understand the gearing, liquidity and value of the company. This can be measured using Debt to Equity ratio for gearing, and Current Ratio for liquidity looking at the industry averages given.
Gearing
The debt to equity ratio measures the ratio of a company’s interest bearing debt finance to its equity finance (shareholders’ funds). The Debt to Equity ratio indicates how much debt a company is using to finance its assets relative to the amount of value represented in shareholders’ equity. This decreased substantially from 43.9% to 19.2% and still lower than the industry ratio. A high debt/equity ratio generally means that a company has been aggressive in financing its growth with debt. Aggressive leveraging practices are often associated with high levels of risk. This may result in volatile earnings as a result of the additional interest expense. It can be evidenced that Ashtown Ltd is not highly geared and it can improve on this by retaining substantial portions of the earnings generated internally.
Liquidity
Liquidity ratios are a class of financial metrics used to determine a company’s ability to pay off its short-terms debts obligations. Generally, the higher the value of the ratio, the larger the margin of safety that the company possesses to cover short-term debts. The current ratio is a liquidity ratio that measures whether or not a firm has enough resources to meet its short-term and long-term obligations. Ashtown Ltd has improved from (1.84:1 to 2.36:1) more than the industry average of 2:1. A high current ratio may not always be a green signal. Ashtown Ltd with high current ratio of 2.36 may not always be able to pay its current liabilities as they become due because of a large portion of its current assets consists of slow moving (available for sale instruments and inventories) or obsolete inventories.
Conclusion
Ashtown Ltd’s profit margins appear to be reasonable for a company in its industry sector. Although it’s net profit margin is below the industry average. It is possible at least some of this improvement can be achieved by deliberately reducing the operating expenses for the year. There are no apparent gearing or short-term liquidity problems but Ashtown Ltd should find solution of reducing its slow moving short term assets.
b) Krofrom Ltd is also a listed company operating in the manufacturing sector in Ghana. The non-current asset turnover ratio of Krofrom Ltd for the year 2015 is 1.3. Compute the non-current asset turnover ratio for Ashtown Ltd and explain TWO reasons, why these ratios may not provide a good comparison of the efficiency of the entities. (3 marks)
View Solution
Ashtown Ltd (2015)
Non-Current Asset Ratio = Sales/Non-Current Assets
= GHS365,000/GHS240,000
= 1.52 times.
Krofrom Ltd= 1.3times Ashtown Ltd =1.52 times
Reasons:
- The non-current assets of one entity could be nearing the end of their useful life and therefore be unrealistically low giving a higher non-current asset turnover figure.
- Alternatively, the non-current assets of one entity could have been revalued which would result in asset turnover being low but not necessarily because of low efficiency.
